
Learn how to get the most out of the MyEnergi app to monitor your solar panel generation, energy consumption, and device usage in real time.
This step-by-step tutorial walks you through every feature of the app—from the live dashboard to detailed analysis screens—so you can better understand where your energy comes from and how it’s being used.
We’ll cover how to interpret the green leaf icon, check your imported/exported energy, and dive into detailed graphs for consumption, generation, and device-specific performance.
Timestamps:
0:04 – Introduction to the MyEnergi App
0:12 – Navigating the live dashboard
0:27 – Accessing the energy overview screen
0:34 – Energy analysis screen explained
0:48 – Energy measured by MyEnergi device (Eddi)
0:57 – Solar panel generation reading
1:19 – Green leaf percentage meaning
1:26 – Digging deeper into consumption and generation figures
2:21 – Analysing performance history (landscape view)
3:09 – Example of immersion energy diverted from solar
What you’ll learn:
How to read the MyEnergi app’s live dashboard
How to view detailed breakdowns of solar generation and energy consumption
How to analyse historical data and device-specific usage
How to check import/export trends
How To Use MyEnergi App
0:04
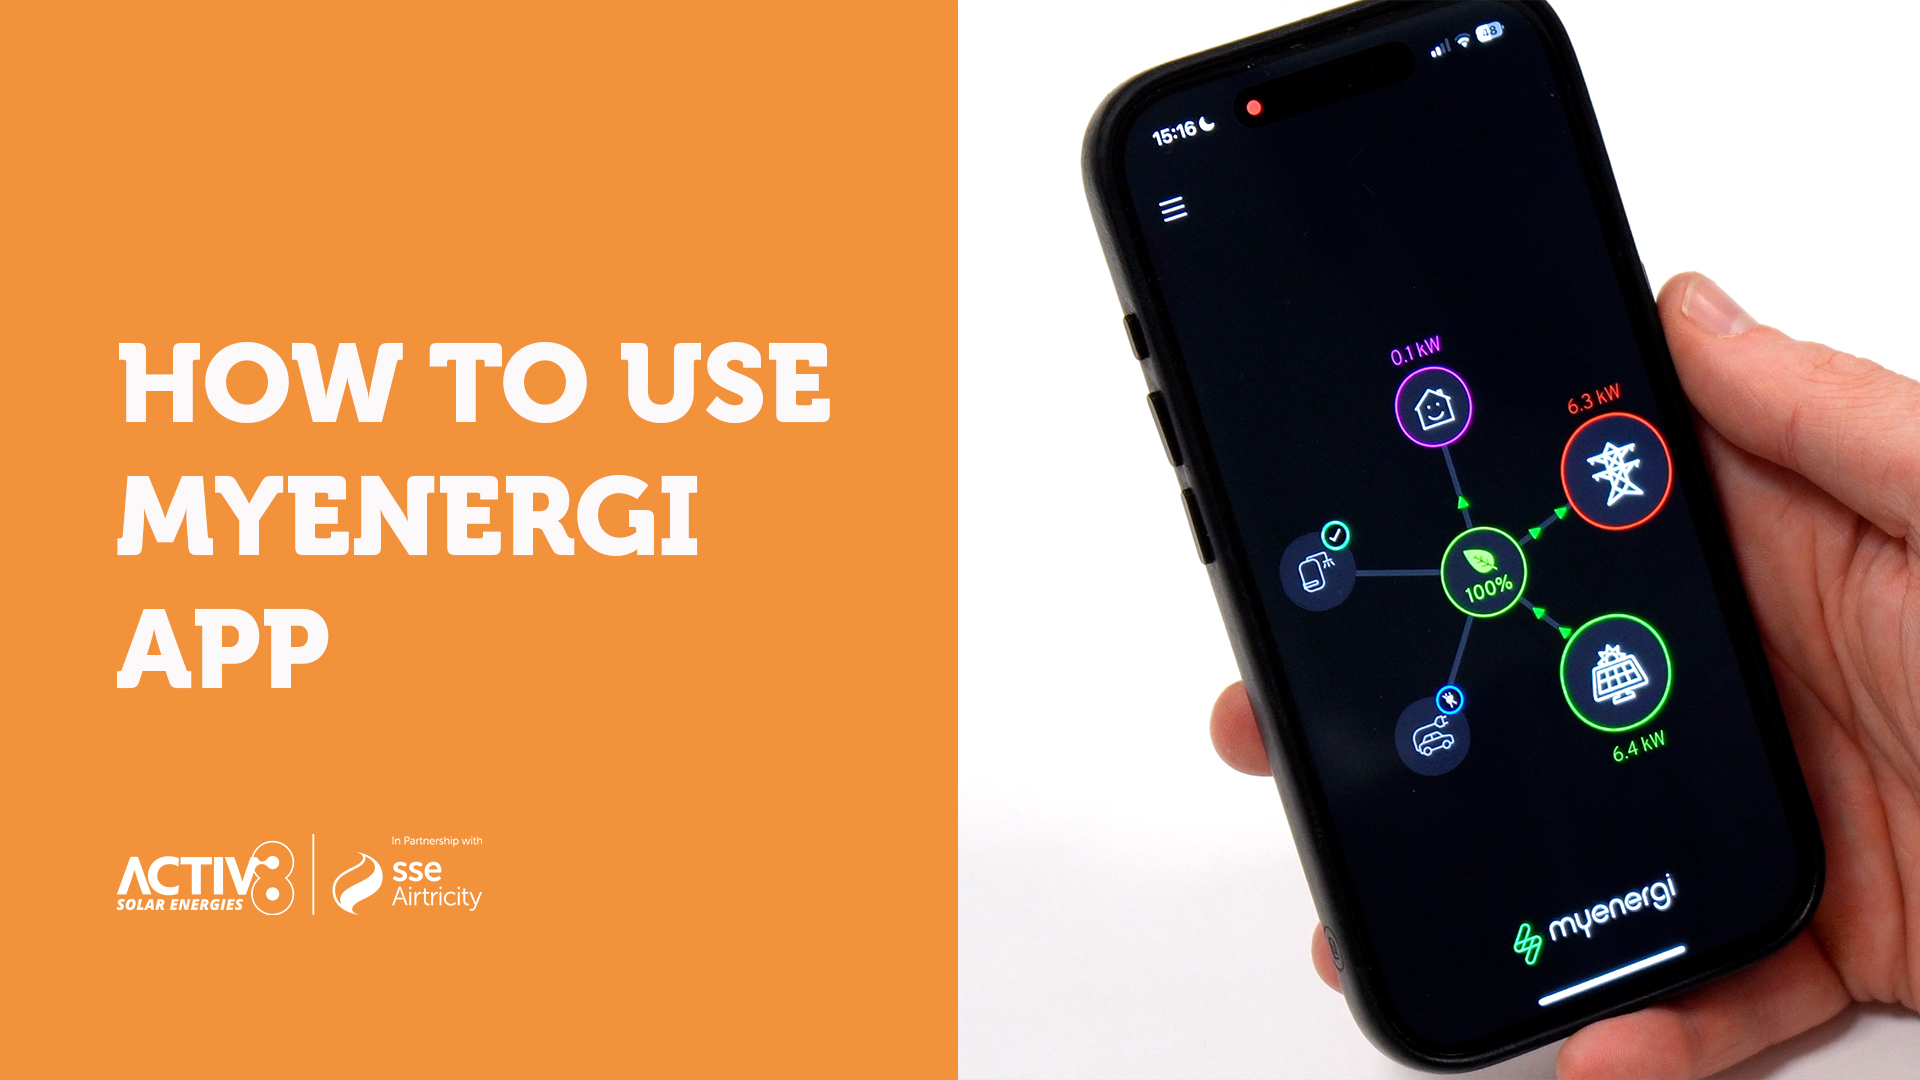
How to Use the My Energy App The My Energy app provides lots of information on your energy usage as well as the live display that appears when you first open the app.
0:12
You can dig into the energy data by selecting any of the icons on the screen.
0:16
The green leaf in the middle of the screen indicates how much of the power you are currently using comes from your solar panel generation.
0:23
100% of the energy being used is coming from the solar panels.
0:27
Selecting the Green leaf icon at the centre of the screen provides an overview of all your devices and energy usage.
0:34
This is the energy analysis screen.
0:36
When the screen opens it defaults to showing the totals all in kilowatt hours.
0:41
Firstly you have consumption which you can see here is 13.3 kilowatts.
0:45
This is the total energy used within the property.
0:48
That includes all of the energy measured by the My Energy device, which is yourEddy.
0:52
In this case, the energy used by anything else in the property generation.
0:57
This is the generated by the solar panels on your roof.
1:01
Imported.
1:02
This is the energy imported from the grid consume generation.
1:07
This is the energy that was generated by the panels that was used inside your home and exported energy.
1:14
This is the energy that has been generated locally and exported to the grid.
1:19
The green leaf percentage in the middle.
1:21
This is an indication of how much of the energy used has come from your solar panels.
1:26
By selecting the boxes at the top of the display, it's possible to dig in deeper to these figures.
1:32
The left hand figure consumption focuses on where the energy came from to supply all the loads in the property.
1:41
The right hand figure generation focuses on how the local solar power has been used.
1:47
You can Scroll down on this page to look at your energy graphs.
1:52
The first graph provides details of the overall energy usage and where it comes from.
1:56
On this screen you can see 6.1 kilowatts has been consumed, 7.2 kilowatts has been imported, and 18.7 kilowatts have been exported.
2:07
The last graph focuses on the device usage.
2:11
Here you can see that my home has consumed 8.9 kilowatts and the Eddy itself has consumed 4.4 kilowatts to heat my hot water.
2:21
To further analyse the performance history or the device usage, you can press the icon in the top right then by flipping your phone.
2:32
Get more information on a day-to-day basis.
2:36
Use the calendar in the top right to select other days periods of time and select the bars to show you the full consumption figures.
2:47
If you want to see specifically what has been imported and exported, you select the grid icon.
2:54
If you select the solar panels icon, this will show you your generation history.
2:59
If you tick into the cylinder icon, this will show you energy that has gone into your hot water cylinder from your solar panels.
3:09
You can see today that 4.45 kilowatt hours has been diverted into my immersion.
Lorem ipsum dolor sit amet, consectetur adipiscing elit.